
This silly little project is an analog clock, with the hours arranged in alphabetic order. Available in four languages.


I came across an interesting data set: an illustration of how housing prices vary relative to disposable income in OECD countries. I wanted to create a map that shows this data set visually. To be sure, there are some online tools that do this, and I also learned how to do it using the R language. But, I figured, it should be possible to build a simple interactive tool that suits my needs.
Well, I did just that, with the help, this time around, of the Grok-2 AI. (Yes, I know, I know... But it works.) Here's another example, a map of GDP per capita, latest (as of early 2025) available values around the world:
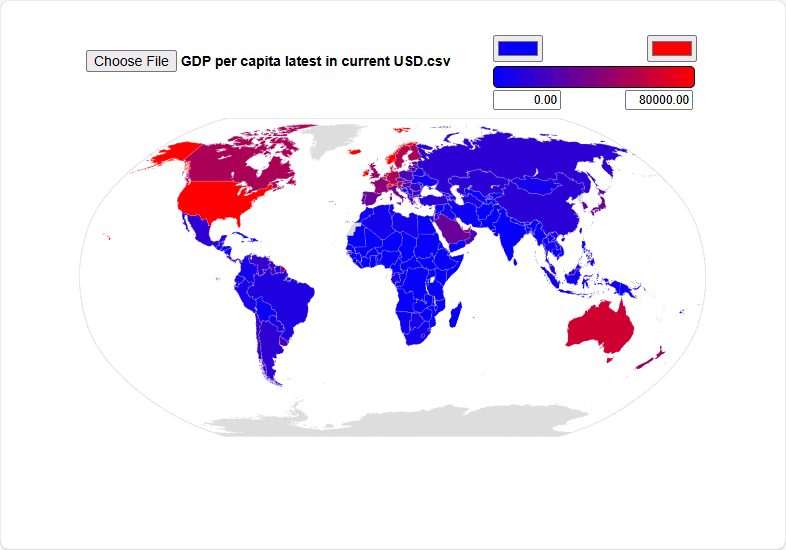
The tool is easy to use: Just click Choose File and upload a CSV (comma-separate values) containing rows with country names (most commonly used names are accepted) and values. You can adjust the range of colors and also the values associated with them; values outside the range will be colored the same.

